
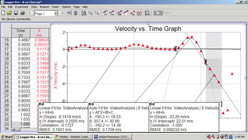
This is a revised version of my Velocity vs. Time graph.
Velocity vs. Time: My velocity starts at 0.2505 m/s Then decreases at a rate of 0.1419 m/s/s until 0.8 s when it increases at a rate of 13.56 m/s/s then at 0.9 s my velocity sharply decreases at a rate of -35.59 m/s/s My feet are going quickly upward and then they come down.
Velocity vs. Time: My velocity starts at 0.2505 m/s Then decreases at a rate of 0.1419 m/s/s until 0.8 s when it increases at a rate of 13.56 m/s/s then at 0.9 s my velocity sharply decreases at a rate of -35.59 m/s/s My feet are going quickly upward and then they come down.
My World In Motion
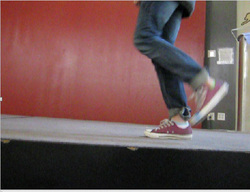
This is an image of a tap step that I am doing called a time step. It is made up of essentially a tap move called a flap, a step ball change and a couple jumps and shuffles. This picture shows a shuffle into a jump.
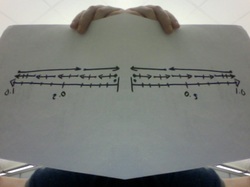
This is the motion map for my project. I had fun doing my motion map because after it was explained to me, I really understood it well. You can see in my motion map everything that the explanations and the other graphs show.
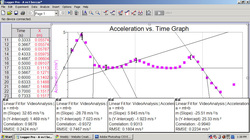
This is a revised version of my acceleration vs. time graph.
Acceleration vs. Time: My acceleration begins at 32.65 m/s^2/s. It then decreases at a rate of -25.51 m/s^2/s. You can tell when tracking my left foot that it is going quickly upwards then slowly downwards.
Acceleration vs. Time: My acceleration begins at 32.65 m/s^2/s. It then decreases at a rate of -25.51 m/s^2/s. You can tell when tracking my left foot that it is going quickly upwards then slowly downwards.
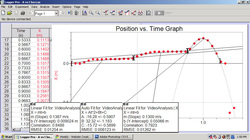
This is a revised version of my Position vs. Time graph.
Position vs. Time Graph: As time increases I go at a constant rate of 0.5645 m/s then decrease to 0.4330 m/s. I then go backwards at a rate of -2.181 m/s. This is because my feet are going up and backwards.
Position vs. Time Graph: As time increases I go at a constant rate of 0.5645 m/s then decrease to 0.4330 m/s. I then go backwards at a rate of -2.181 m/s. This is because my feet are going up and backwards.
